
Covid-19: Twitter Sentiment Mapping (Phase 2 of 2)
We applied our capabilities to Twitter to identify areas of particular interest as the COVID pandemic took hold.
Food, and delivery, in particular, stood out. The general topic of "delivery" accounts for roughly 30% of the total volumes we analyzed accompanied by very strong positive and negative sentiments on a sustained basis. We detected these activities in near real-time as deaths spiked and lockdowns intensified.
Tracking Sentiment Volatility Over Time (on Twitter Since the Beginning of the Pandemic)
Keyword Asset Created For: "delivery"
Time Periods:
Period 1: March 18, 2020 - March 23, 2020
Period 2: March 24, 2020 - March 30, 2020
Period 3: March 31, 2020 - April 6, 2020
Period 4: April 7, 2020 - April 13, 2020
Period 5: April 14, 2020 - April 20, 2020
Period 6: April 21, 2020 - April 28, 2020
Period 7: April 29, 2020 - June 5, 2020
Last Updated:
June 6, 2020
Number of data points:
298,226
Chart: Sentiment Volatility Over Time
Keyword Asset: "delivery"
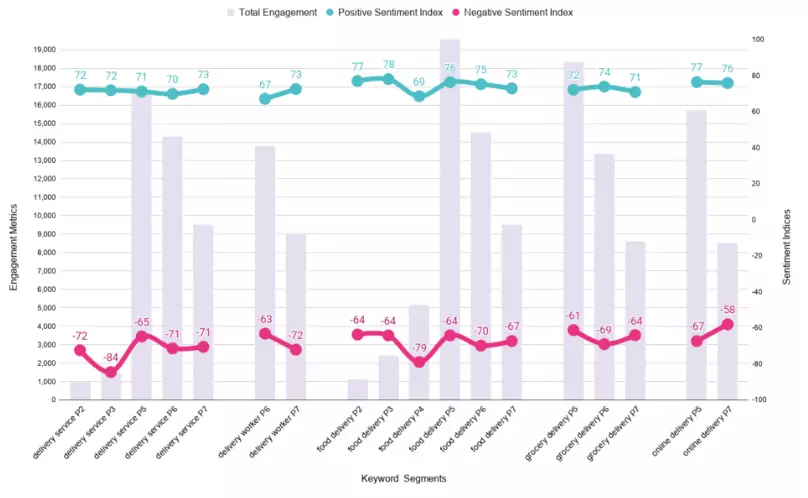
How To Read This Chart
(X-Axis) Keyword & Time Period Segments
The keywords you see here are representative of major thematic groupings detected by talkAItive.
delivery service
delivery worker
food delivery
grocery delivery
online delivery
(Y-Axis-Left) Engagement Metrics
These bars represent an aggregation of both positive and negative Mentions, Likes, and Retweets. Engagements scored as ‘neutral’ were removed.
(Y-Axis-Right) talkAItive Sentiment Indices
talkAItive assigns a sentiment score that reflects a particular segment’s emotional intensity; scores range from -100 to 100.